
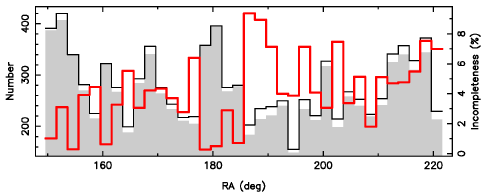
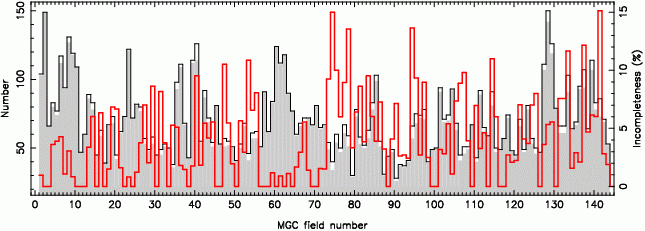
The top three plots show the MGC's redshift incompleteness as a
function of BMGC, effective surface brightness and colour,
the middle plot shows the incompleteness as a function of RA across
the MGC strip, while the bottom plot shows the incompleteness as a
function of MGC field number. In all the plots solid lines show the
total number of clean galaxies from MGC-BRIGHT, while the grey shaded
histograms show the number of clean galaxies with good quality
redshifts (left vertical axis). The red lines show the redshift
incompleteness (right vertical axis). Dashed lines mark the overall
redshift incompleteness of 3.95%, ie. of the 10095 galaxies in our
sample 9696 have good quality (Z_QUAL >=
3) redshifts. Of the remainder, 214 objects were observed but the data
did not yield a good quality redshift, while 185 objects (1.83%) were
never observed.
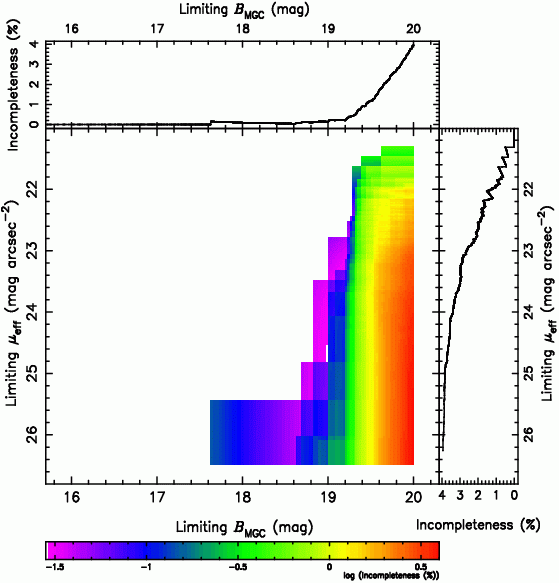
This plot shows the redshift incompleteness as a function of limiting
magnitude and limiting effective surface brightness. The grey-scale is
in log units. The side panels show the incompleteness separately as a
function of limiting magnitude (top) and limiting surface brightness
(right). The incompleteness kicks in at about BMGC = 19.2
mag and builds up gradually in surface brightness from about 21
mag/arcsec2 onwards. While the overall (ie. BMGC
< 20 mag) incompleteness is 3.95% we can see from the top panel that
for BMGC < 19.2 mag the incompleteness is only 0.21%
(4298/4307)!
The MGC redshift data consist of existing, publicly available data,
supplemented by the MGC redshift survey, MGCz. Here we list the number
of redshifts of clean galaxies from MGC-BRIGHT contributed by each
survey:
| Survey | # of galaxies for which at least one good quality redshift was contributed | # of best redshifts contributed |
|---|---|---|
| SDSS-DR1 | 2909 | 1528 |
| 2dFGRS | 4129 | 3152 |
| 2QZ | 19 | 13 |
| NED | 1200* | 29 |
| PF | 37 | 28 |
| LSBG | 11 | 2 |
| MGCz | 5054 | 4944 |
| Total | 9696 |
*Eventhough SDSS, 2dFGRS and 2QZ objects were explicitly excluded from the NED catalogue it is clear that many of the NED redshifts originate from one of these surveys. These duplications were excluded from the zbest - zother distribution below.
MGCz was mainly conducted using 2dF on the AAT. However, additional
observations were obtained with ANU 2.3m/DBS, TNG/DOLORES,
NTT/EMMI and Gemini/GMOS. The following table details the number of
redshifts contributed to MGCz by each telescope:
| Survey | # of galaxies for which at least one good quality redshift was contributed | # of best redshifts contributed |
|---|---|---|
| AAT | 4886 | 4766 |
| 2.3m | 92 | 80 |
| TNG | 43 | 42 |
| NTT | 53 | 52 |
| Gemini | 4 | 4 |
| Total | 4944 |
The following series of plots illustrates the contribution of each survey and telescope. It shows the redshift incompleteness as a function of BMGC and MGC effective surface brightness as the various spectroscopy samples are added in.
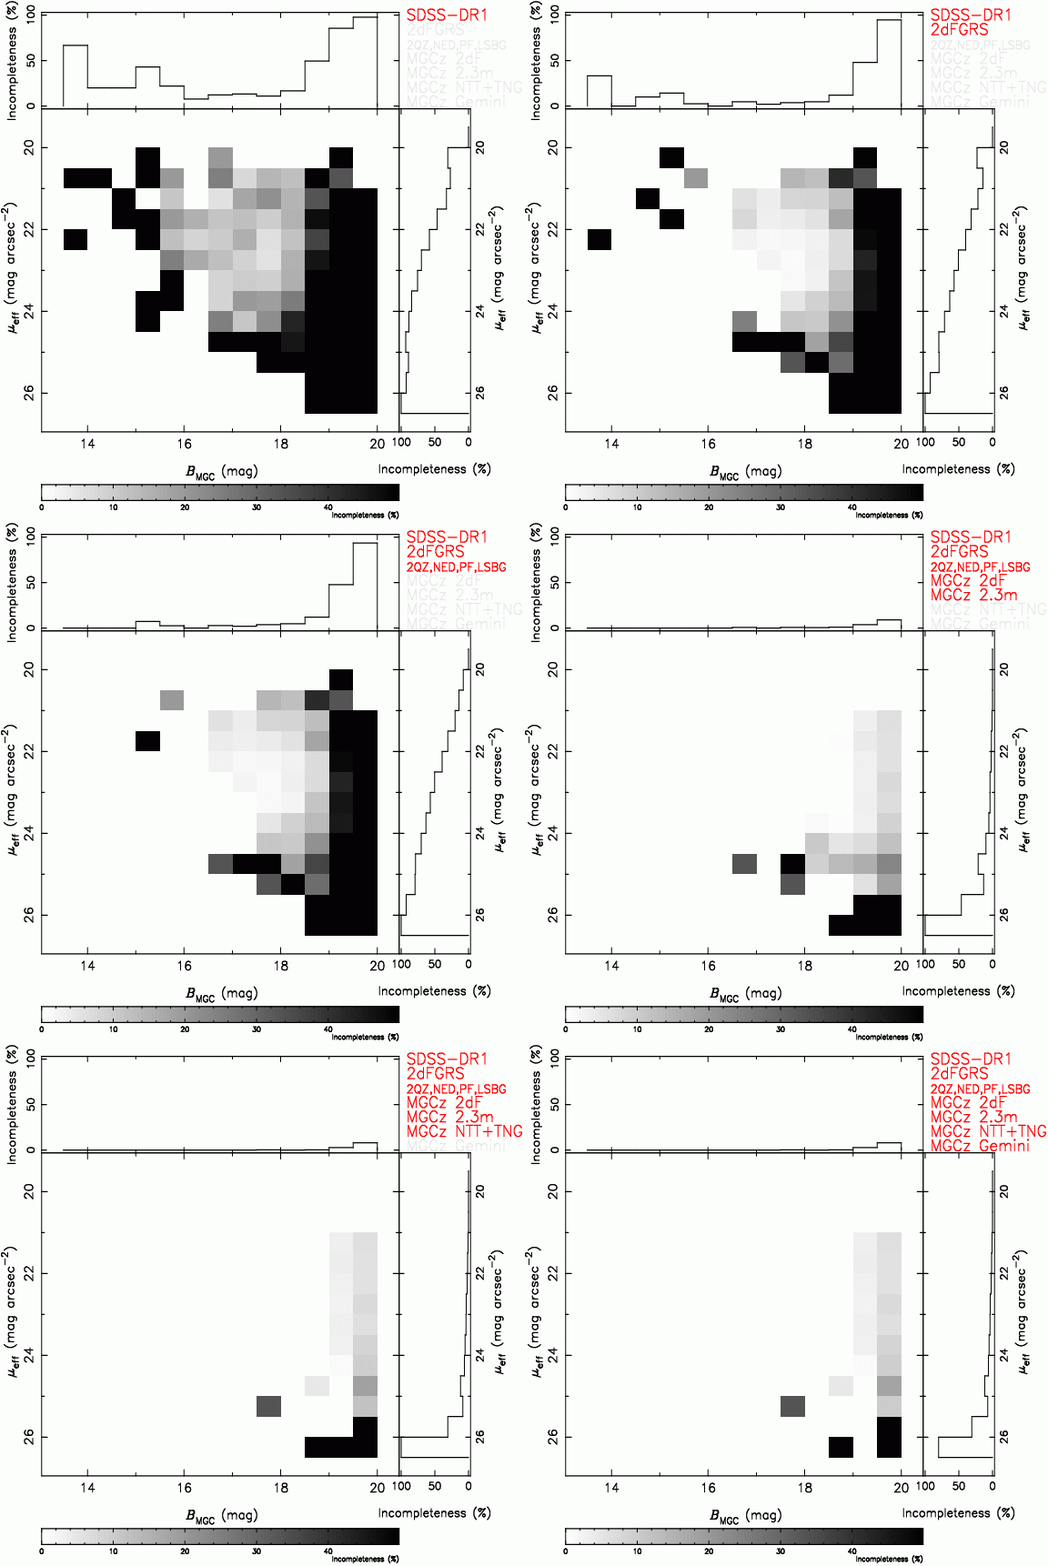
The illustration demonstrates the value of our long-slit campaign: the
2.3m observations "mopped up" at BMGC < 19.2 mag and
mueff < 24 mag/arcsec2. With the observations on
the 4m-class telescopes (NTT and TNG) we targeted objects at
BMGC < 19.2 mag and mueff > 24
mag/arcsec2, while Gemini provided a few redshifts for the
very faintest and lowest surface brightness galaxies.

Similar to Fig. 2 of Paper V. 2703 galaxies have more than one good quality redshift. In total they have 6226 redshifts. For each of these objects one of its redshifts is chosen as the best (based on the quality of the spectrum) and we compare the object's other redshift(s) to this best redshift. In total this results in 3523 redshift pairs. The above plot shows the histogram of their differences. The distribution has an rms dispersion of 92 km/s. The red solid line is a Gaussian with the same median and rms as the data. The short horizontal lines show the rms of the Δz distribution as a function of Z_QUAL.
The following table lists the number of clean galaxies whose best redshift has a given Z_QUAL.
| Z_QUAL of best z | # of galaxies | median S/N of best spectrum | rms of δz distribution of duplicate redshifts in km/s | ||
|---|---|---|---|---|---|
| 1 | 19 | - | |||
| 2 | 195 | 4.3 | |||
| 3 | 2503 | 6.3 | 10.6 | 132 | 92 |
| 4 | 5663 | 11.7 | 95 | ||
| 5 | 1530 | 20.1 | 80 | ||
| not observed | 185 | ||||
| Total | 10095 | ||||
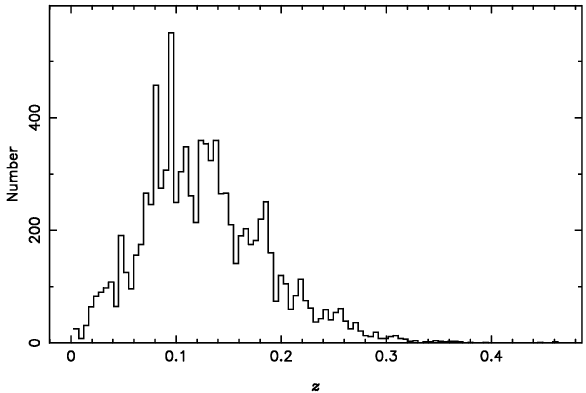
The MGC redshift distribution. The median is 0.122.

Similar to Fig. 4 in Paper V. This plot
shows absolute magnitude versus redshift. We have used a k+e
correction of 2.5z + 2.5 log[(1+z)-0.75]. The red lines
show the bright and faint apparent magnitude limits of BMGC
= 13 and 20 mag respectively. For orientation, the horizontal dashed
line shows the 2dFGRS M* value. The little arrows indicate the
locations of Abell clusters in the RA range of the MGC and with -1 <
DEC < +1 deg.
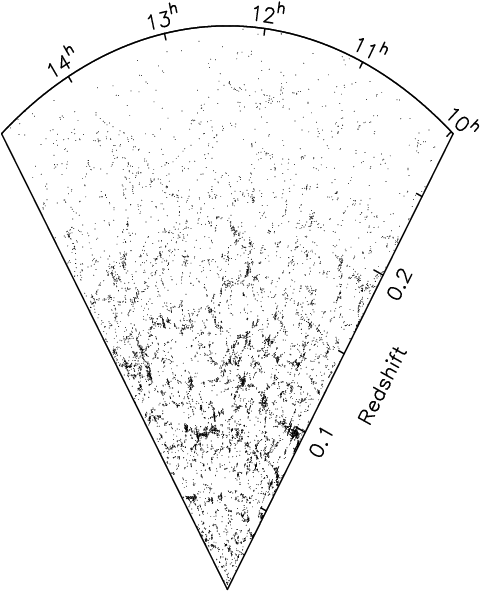
The MGC redshift cone.
Joe Liske