Fig. 6 from Paper I. Upper panel: colour-corrected zero-points versus airmass. Lower panel: airmass-corrected zero-points versus colour. The solid lines show the best fit which leads to the MGC colour equation:
BMGC = BLandolt - 0.145 (B-V).

Fig. 7 from Paper I. This figure demonstrates the internal photometric accuracy of the MGC. Left panel: median magnitude differences of doubly detected objects with 17 < BMGC < 21 mag and stellaricity > 0.5 in overlap regions of adjacent fields. Solid points indicate overlap regions involving at least one photometric observation. Right panel: frequency distribution of all of the individual ΔBMGC values (solid line), which has a mean of -0.002 mag and an rms of 0.023 mag.
Comparison with SDSS-DR1 photometry, see also Paper III:
(Will be replaced with
final DR when available.)

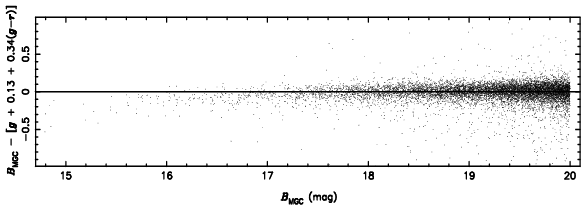
This plot shows the difference between BMGC and SDSS-DR1 Petrosian g-band magnitude as a function of the SDSS-DR1 model magnitude (g-r) colour for clean galaxies with a one-to-one match between MGC and SDSS-DR1. The red line shows the best fit after iteratively fitting and rejecting points more deviant than 3 sigma until no more points are rejected. The result is:
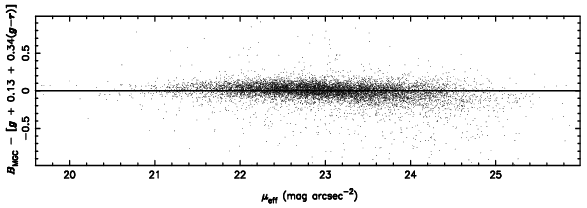
BMGC = gPetrosian + 0.13 + 0.34 (g-r)model


The residuals of the above fit as a function of BMGC and MGC effective surface brightness. The residuals have a mean of 0 and an rms of 0.08 mag. Bright and very low-surface brightness galaxies appear to be systematically fainter in the SDSS-DR1 than in the MGC.


The median residuals of the above fit as a function of MGC field
number and CCD number. The error bars are the 68%ile ranges / sqrt(n).
The overall shape of the former figure correlates to some extent with
the shape of the median magnitude differences in the overlap regions
above, indicating that this is probably a systematic error due to the
zero-point determination. However, the amplitude of the large-scale
features is not (much) larger than the presumably random
field-to-field scatter and so this is not corrected for. In any case,
the remaining zero-point error is of order 0.05 mag. In most
scientific analyses we will account for this error by deriving errors
from jackknife resampling.
There also seems to be a significant systematic effect as a function
of CCD, although at a very low level. This is probably best understood
in terms of the next figure.

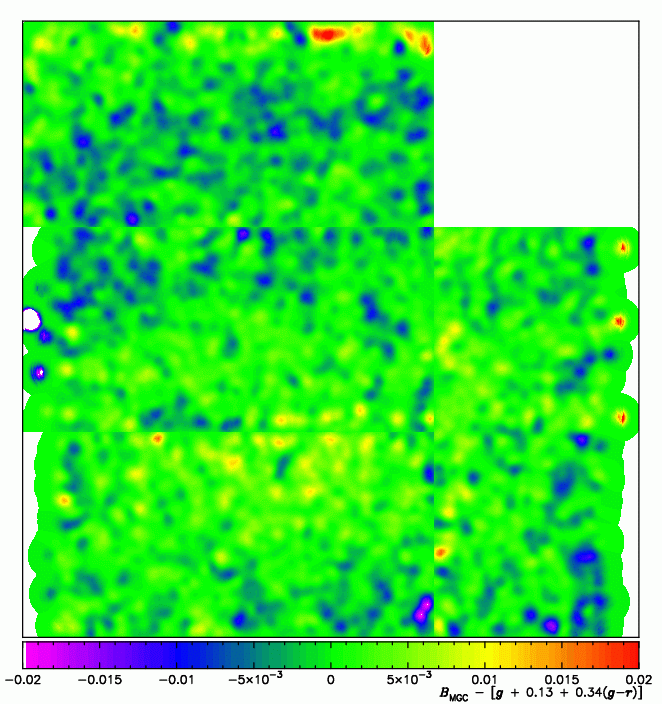
The smoothed residuals of the above fit as a function of position for each CCD. The CCDs are arranged as they are in the WFC (see the survey footprint plot). The ragged edges on the left and right of the bottom two thirds of the plot are due to the overlap regions. If you squint you can see that there may be a small remaining flat-fielding issue. The smoothed ΔB surface seems to show a peak roughly near (x, y) = (middle, one third up), ie. near the edge between CCDs 1 (bottom left) and 4 (middle), with a circle of lower ΔB values around it. This is somewhat reminiscent of the WFC layout (see also the CASU WFS pages).
Joe Liske