The MGC survey region is delimited by 9 58 28 < RA < 14 46 45 and -00 18 00 < DEC < +00 18 00. The total area imaged is 37.5 deg2. The picture below shows the position of the MGC survey region on the sky and in relation to the APM survey and the 2dFGRS.

The above picture was "borrowed" from the 2dFGRS web pages. The MGC survey region is indicated by the thick green line along the DEC=0.
Due to the setup of the Wide Field Camera (WFC), the detailed survey geometry is actually quite complicated. The picture below (Fig. 2 from Paper I) shows the footprint of the first three MGC fields.

Note the substantial overlap regions between adjacent fields. These were used in the photometric calibration of the survey. The yellow lines show the adopted field limits which divide the overlap regions.
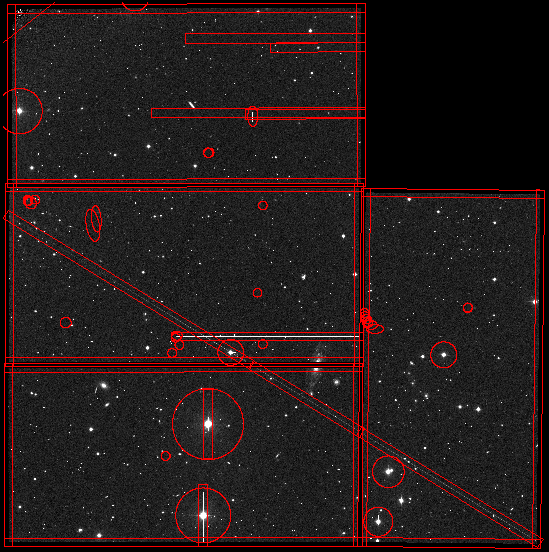
In addition, there are many so-called "exclusion regions", which are due to CCD defects, gaps between CCDs, very bright stars and galaxies, diffraction spikes, etc. The exclusion regions are shown in red in this example field below (MGC field 36, Fig. 4 from Paper I).

All objects within these regions have been flagged in the object catalogues (parameter INEXR) and are excluded from scientific analyses because their photometry is compromised. The exclusion regions reduce the effective area of the survey to 30.88 deg2.

Fig. 3 from Paper I. Summary of the data quality across the MGC survey strip. The dots in the uppermost panel indicate the location of the photometric calibration fields.
Joe Liske